

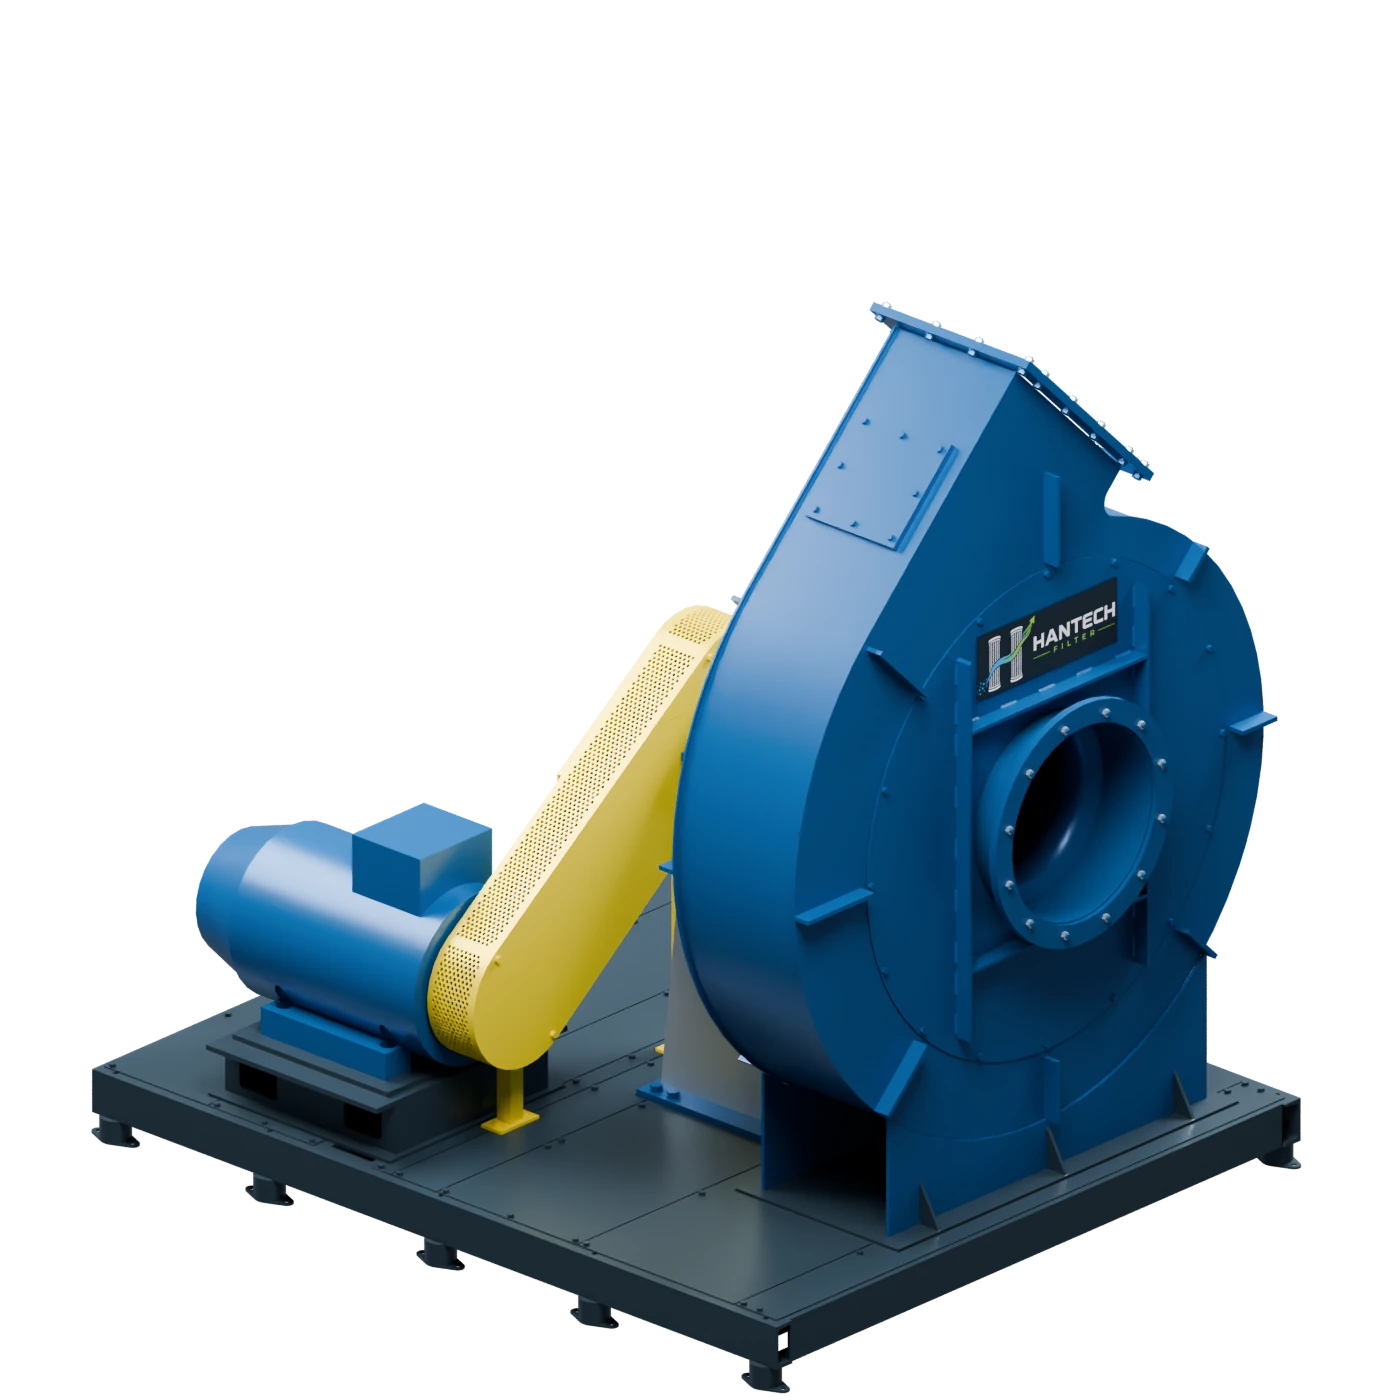
Industrial fan selection cannot be made based on motor kW or fan diameter alone; suction flow rate, duct velocities, filter dP, cyclone/damper losses, air leakage, and fan operating point must all be calculated together.
The First Answer in Fan Selection: Flow Rate and Static Pressure Read Together
Industrial fan airflow and static pressure calculation determines the actual operating point of a dust collection system. A high motor power does not automatically make a fan the right choice; it must be verified that the fan can deliver the airflow the process requires under the combined pressure losses of the ductwork, cyclone, baghouse filter and stack line.
On the dust collection side, fan selection rests on three main questions: how much air will be drawn from which suction points, at what duct velocities will this air be conveyed, and what will the total system resistance be in Pa/mmWC? Hantech Filter evaluates the fan not as a standalone product but together with the baghouse filter system, ductwork, hopper, pulse-jet behavior, and performance measurement.
The practical rule is this: a bigger fan is not always the solution. If there is high dP, a blocked duct, a closed damper, or air leakage, upsizing the fan increases energy consumption but may not fix the root cause.
How Is Flow Rate Determined? Capture Point, Duct Velocity, and False Air
Required suction airflow is determined primarily by the dust source, the suction inlet/hood geometry, and the required capture conditions. The duct cross-section is then sized to carry that airflow at the proper transport velocity. That's why dust extraction design doesn't start with duct velocity; first you understand where the dust is released and at what velocity/energy.
| Data | Why is this necessary? | Hantech check |
|---|---|---|
| Hood / weld geometry | The basis of the required suction flow rate | Opening area, distance, and dust discharge direction are visible |
| Capture velocity | Determines the ability to capture dust at the source | Verified through process air movement and operator impact |
| Channel conveying speed | Prevents dust from settling inside the duct | The calculated flow rate is verified against the duct cross-section |
| Dust type | Affects conveying speed and wear risk | Fine/sticky/abrasive distinctions are made |
| Leakage air | Wastes fan flow rate | Cover, flange, rotary valve, and cell plate are checked |
| Process variability | Shifts the fan operating point | Shift and capacity records are requested |
Here Q = A x v is the correct formula, but what A and v represent changes the decision. In a hood calculation, A can be the capture opening/effective suction area and v the required capture velocity; in duct sizing, A is the duct cross-section and v is the duct transport velocity. Duct velocity should not be used as if it alone determines the suction flow rate the process needs.
At this stage, theoretical flow alone is not sufficient. Especially on older lines, loose covers, leaking flanges, leaking rotary airlocks, and open inspection doors can convert part of the air the fan draws into useless false air. At such a site, a false-air check should be carried out before upsizing the fan.
Worked Example: Flow Rate Calculation for a Packaging Line with 4 Suction Points
Sample flow rate calculation
- Suction point
- 4 packaging transfer points
- Each point target flow rate
- 4,500 m³/h
- Process flow rate
- 4 x 4,500 = 18,000 m³/h
- Leakage/balance margin
- Example training basis: 10%
- Design flow rate:
- 18,000 x 1.10 = 19,800 m³/h
- m³/s conversion
- 19,800 / 3,600 = 5.50 m³/s
This example shows only the flow-rate side. Selecting a 19,800 m³/h fan is not enough on its own; whether that same fan actually delivers this flow under the system resistance must be read from the fan curve. If the fan drops from 19,800 m³/h to around 15,000 m³/h as the filter dP rises, dust can start escaping at the capture points.
Hantech does not apply a false-air allowance in this calculation as an automatic standard. In a new, well-sealed system the allowance is lower; in an older line with leaks at doors and rotary valves it can be higher. Reducing leakage first can be more economical than upsizing the fan.
How Is Static Pressure Totaled? The Duct, Filter, Cyclone, and Stack Chain
Static pressure requirement is the total system resistance the fan must overcome. Duct friction, elbows, contraction-expansion fittings, dampers, cyclones, baghouse filter dP, silencers, and the stack outlet all add up in the same chain. This value is expressed in Pa or mmWC; conversion can be done taking 1 mmWC as approximately 9.81 Pa.
| Source of loss | Sample training value | Note |
|---|---|---|
| Duct and elbows | 700 Pa | Depends on length, velocity, and number of elbows |
| Cyclone / pre-separator | 900 Pa | The efficiency-pressure balance varies by design |
| Bag filter dP | 1,500 Pa | Varies with clean/dirty condition and media behavior |
| Stack, silencer, damper | 400 Pa | Depends on the accessory and outlet conditions |
| Total | 3,500 Pa | Flow rate is sought at this point on the fan curve |
This table is not a definitive design value; it is an example showing how to read the data. Actual pressure losses must be verified against the duct layout, air velocity, equipment datasheets, filter dP trend, cyclone geometry, and damper position on site.
Hantech Engineering Note
It should be checked whether the pressure definition used on the fan selection curve is Fan Static Pressure (FSP) or Fan Total Pressure (FTP). Directly comparing a site static pressure measurement with the manufacturer's total-pressure curve can lead to an incorrect interpretation of the operating point. In particular, if the velocity pressure at the fan inlet/outlet is not accounted for, the measured value and the catalog curve may not represent the same quantity.
Worked Example: Preliminary Fan Power Check
Sample power control
- Design flow rate:
- 19,800 m³/h = 5.50 m³/s
- Total static pressure
- 3,500 Pa
- Overall fan/efficiency assumption
- 0.65 sample training basis
- Spindle power approach
- P = Q x ΔP / η
- Account
- 5.50 x 3,500 / 0.65 = 29.6 kW
- How to Choose Engine Lubricant
- A higher, safer class is evaluated using the service factor and the fan curve
This calculation should not be used on its own to select a motor rating; it must be verified against the fan manufacturer's curve, temperature, gas density, belt/coupling losses, service factor, and operating point. For a quick check, however, it shows this: at the same flow rate, energy demand rises directly as pressure drop increases.
That is why Hantech looks first at reducing unnecessary pressure losses. Selecting a bigger motor while the filter is clogged, the damper is wrong, or the duct velocity is excessive only raises operating cost permanently.
Why Is the Fan Operating Point More Important Than Motor kW?
A motor power rating printed on a fan nameplate does not mean that fan will deliver the same flow at every pressure. The fan curve shows the relationship between flow and static pressure. As system resistance rises, the operating point shifts left along the curve and flow drops. When filter dP increases or a duct becomes blocked, this is usually why suction drops at the site.
The operating point is the intersection of the two curves
With a clean filter, the system curve sits lower, and the fan can deliver about 19,800 m³/h at point A. With a dirty filter, the system curve shifts upward; point B can drop to around 15,500 m³/h, for example.
Fan selection, therefore, is not about picking a flow or pressure value; it is about selecting the operating point where the fan curve intersects the system curve. When a dirty filter shifts the system curve upward, the fan can drop to a lower flow at the same speed.
Under these conditions, I would not simply increase the fan speed. First the filter dP trend, duct blockage, damper position, fan impeller fouling, belt tension, false air, and motor current are checked. Because a higher speed can increase noise, vibration, and energy cost.
Field Diagnosis: What to Check First When Suction Is Weak?
| Symptom | Possible reason | Check Row |
|---|---|---|
| Weak suction + high filter dP | Filter bag blinding, high A/C ratio, weak pulse | dP trend, valve sound, tank pressure, bag surface |
| Weak suction + normal filter dP | Duct blockage, closed damper, dirty fan impeller | Damper, duct, fan current, impeller inspection |
| Motor current too high | Excess flow rate, open damper, incorrect fan operating point | Current, damper, and flow measurement |
| Low motor current + poor extraction | Fan is not moving air, blockage, or reverse rotation | Rotation direction, inlet blockage, belt/coupling |
| Dust is leaking but dP is low | Filter bag tear, bypass, or leakage | Cell plate, bag collar, leak test |
In this diagnostic flow, the first action is not to purchase a fan. Most problems in the field can be isolated through measurement: if dP is high, the issue is on the filter side; if dP is normal but suction is weak, it points to the duct/fan side; if dP is low but emissions are present, it points to leakage or bypass.
Note: Motor current must be interpreted together with the fan's impeller type and power curve. Backward-curved, radial, and forward-curved fans do not share the same flow-power characteristic. For this reason, a one-line diagnosis such as "high motor current = excess airflow" should not be used.
When Should I Choose a Larger Fan?
Hantech's engineering decision is clear here: first reduce system resistance and leaks, then verify the fan operating point. A larger fan only makes sense if the process genuinely needs a higher flow rate and the filter/ductwork can actually handle that flow.
Retrofit Decision: Fan, Filter, or Ductwork?
If an existing plant has an extraction problem, the retrofit decision breaks down into three parts. If the filter dP is high and the filter area is insufficient, the filter area or the media/pulse side is examined. If duct velocities and losses are high, duct revision may be required. If the fan curve doesn't meet the system resistance, fan revision or selecting a new fan comes into play.
| Result Measurement | priority decision, 85 | Hantech comment |
|---|---|---|
| High dP with no adequate fan reserve | Filter and fan are examined together | Simply upsizing the fan can increase A/C ratio risk |
| Normal dP + low flow rate | Duct/fan operating point | Damper, blockage, and fan curve are checked |
| High energy + adequate extraction | Yield optimization | Damper loss, fan efficiency, and speed control are reviewed |
| New capacity target | Complete system calculation | Flow rate, A/C ratio, duct velocity, and motor power are recalculated |
Field Fan Performance Measurement: How Are Actual Flow and Pressure Verified?
To verify the fan, the motor nameplate alone is not read on site. A measurement point is selected, and where possible a velocity profile is obtained inside the duct using a pitot traverse or a suitable differential pressure method. Velocity is measured at multiple points to calculate the average duct velocity and flow rate; temperature, density, and duct cross-section are recorded.
| Measure | What does it show? | Why does it matter? |
|---|---|---|
| Channel speed profile | Actual flow rate | A single-point measurement can be misleading |
| Fan inlet static pressure | Suction side resistance | Duct/hood/damper problems are isolated |
| Fan outlet static pressure | Discharge side resistance | Filter, stack, and accessory losses are read |
| Heat | Gas density correction | Comparison quality improves with the fan curve |
| Motor current and RPM | Fan load and operating point | Evaluated on the curve together with Q + ΔP |
The Q + ΔP value is plotted onto the actual operating point on the manufacturer's fan curve. For example, if a fan expected to deliver 265,000 m³/h on site is actually only drawing 220,000 m³/h, the cause may be an undersized fan, increased system resistance, higher filter dP, damper position, or air leakage. Hantech's on-site fan performance measurement helps clarify this before a commercial quote is issued.
What Information Is Needed for a Quote or Site Measurement?
For fan flow rate and static pressure calculations or site performance measurement, please provide the list of suction points, hood dimensions, duct diameters, duct layout sketch, existing fan nameplate, motor kW/speed, damper status, filter dP trend, bag diameter-length-quantity, cyclone/damper/silencer information, process temperature, dust type, operating hours, motor current, and any previously performed flow measurements.
You can submit this data via the quote form. This topic usually needs to be evaluated together with baghouse filter pressure drop, filter retrofit decision, cyclone pre-separator, and dust collector system difference.
Technical Review Note
Technical review: Doğuhan Kırmacı - industrial filtration, dust collection and fan-system performance.
This content has been prepared by reading process flow, fan curve, duct pressure losses, filter dP trend, and field failure symptoms together. The figures here are for illustrative/educational purposes; final fan selection must be verified against the manufacturer's curve, site measurements, and process conditions.
Frequently Asked Questions
How is industrial fan flow rate calculated?
The required suction flow rate is first determined based on the dust source, hood/suction geometry, and capture velocity; the duct cross-section and conveying velocity are then used to check whether this flow rate can be transported without causing settling.
What is fan static pressure?
Fan static pressure is the pressure required to overcome system resistances such as ducts, elbows, cyclones, filter dP, dampers, silencers, and stacks.
Is motor kW alone sufficient for fan selection?
No. Motor kW alone does not guarantee flow rate; the fan curve and system resistance must be read together.
If dP is high, is oversizing the fan the right fix?
Not always. Filter area, bag media, pulse system, duct blockages, and false air should be checked first.
How can fan power be quickly checked?
For an approximate check, P = Q x ΔP / η can be used, where Q is in m³/s, ΔP in Pa, and η is overall efficiency. The final selection must be verified against the fan manufacturer's curve.